AI-Driven Feature Selection in Python!
Deep-dive on ML techniques for feature selection in Python - Part 1
The first part of a series on ML-based feature selection where we discuss popular filter methods like Pearson, Spearman, Point Bi-Serial correlation, Cramer’s v and Information Value
“Garbage in, garbage out!”
This is a phrase anyone building machine learning models can connect with sooner rather than later. It simply means if the input data to a model has a lot of noise the output will be noisy as well.
With datasets having millions of rows and thousands of features nowadays, we need tools to efficiently identify which features to pick for our model. This is where feature selection algorithms fit into the model development journey. Here’s a quick summary of its benefits —
- Model accuracy improves as overfitting and the chance of spurious relationships reduces
- The problem of multicollinearity can be solved
- Reduces data size which helps model train faster
- Models with a small number of relevant features are easier to interpret
I have been building data science models across different firms for 5+ years now and have found feature selection algorithms to be as important as the actual model used for prediction. And a lot of improvements have been made recently in this critical aspect of machine learning modeling. Wouldn’t it be nice to have all the latest and popular feature selection methods explained along with their python implementation in one place? Well, that was the inspiration for this blog!
Blog Series Sections
- Types of Feature Selection Methods (Part 1)
- Correlation: Pearson, Point Bi-Serial, Cramer’s V (Part 1)
- Weight of Evidence and Information Value (Part 1)
- Beta Coefficients (Part 2)
- Lasso Regression (Part 2)
- Recursive Feature Selection and Sequential Feature Selector (Part 2)
- Boruta: BorutaPy, BorutaShap (Part 3)
- Bringing it all together (Part 3)
A) Types of Feature Selection Methods
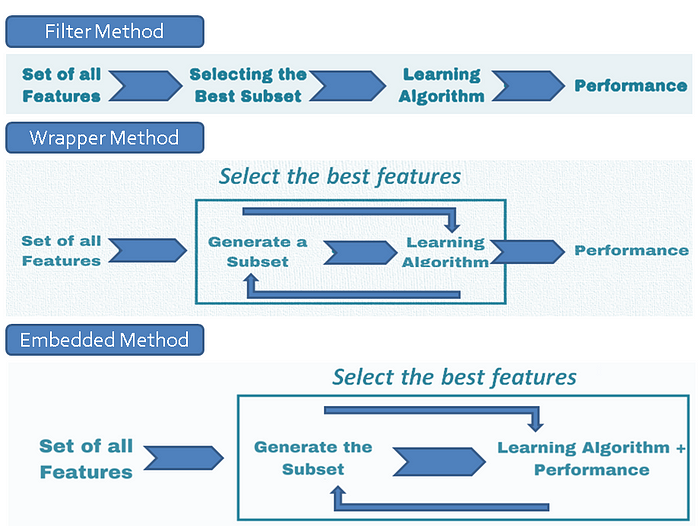
The first thing to note about feature selection algorithms is that they are classified into 3 categories:
- Filter Method: Ranks each feature on a uni-variate statistical metric and picks the highest-ranking features.
Pros: They are model agnostic, easiest to compute and interpret
Cons: The biggest drawback is that they can’t identify features that are weak predictors on their own but are an important predictor when combined with other features
Example: Correlation, Information Value - Wrapper Method: Uses a subset of features and then trains a user-defined model using them. Based on the performance of the model, it adds or removes features from the subset and trains another model. This process goes on till the desired number of features is reached or the performance metric hits a desired threshold.
Pros: As the method is model specific, the selected features perform well on the selected model
Cons: Computationally most expensive and also have the risk of overfitting to a specific model
Example: BorutaShap, Forward Selection, Backward Elimination, Recursive Feature Elimination - Embedded Method: Models like Lasso regression have their own built-in feature selection methods where they add a penalizing term to the regression equation to reduce over-fitting
Pros: Fast computation and better accuracy than filter methods
Cons: Limited models with built-in feature selection methods
Example: Lasso Regression
Here’s a quick summary of the methods:
For this blog series, we are using the “default of credit card clients Data Set” from the UCI machine learning repository. It has a good combination of records (30K) and number of features (24). The specific details of each feature can be found on the website. I have done some basic preparation of the dataset (assigning column types, encoding of categorical variables, etc.) and the code can be found here.
B) Correlation: Pearson, Point Bi-Serial, Cramer’s V
Correlation is the quantification of the strength and direction of the relationship between two variables (in our case, quantification between a feature and target variable). The most common type of correlation is Pearson’s correlation and it is calculated using the following formula:
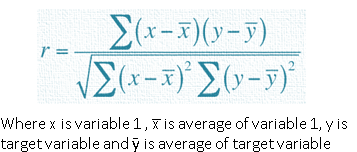
But Pearson correlation can calculate the relationship between two continuous variables only and it is a major limitation (especially for classification problems where the target variable is categorical). None of the correlation metrics can quantify the relationship between all categorical and continuous variable pairs on its own. Hence we need to use different metrics based on variable types. We also need to keep in mind that the metrics should be comparable for purpose of feature selection. With these things in mind, I prefer the following combination:
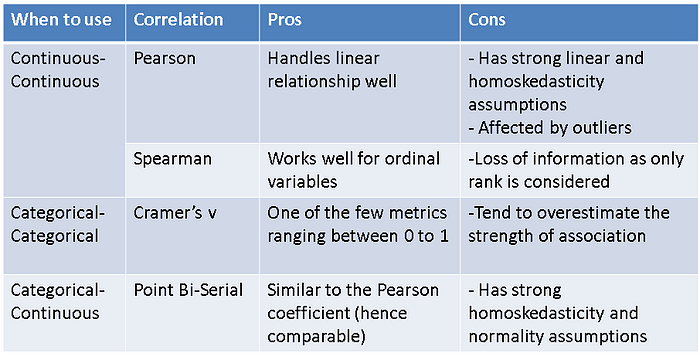
We have already looked at the formula for person correlation, let’s quickly go through the rest mentioned in the table:
i) Spearman:
The first step is to calculate the rank (highest value being rank 1) for each observation for each column separately. Then use the following formula:
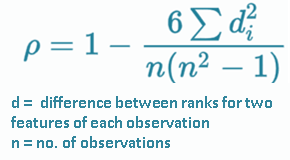
Examples of calculating Spearman correlation can be found here.
ii) Point Bi-Serial:
Point Bi-serial correlation assumes that the categorical variable has two values 0 and 1. We first divide the data into two groups:
group 0: where the categorical variable = 0
group 1: where the categorical variable = 1
Then we use the following formula
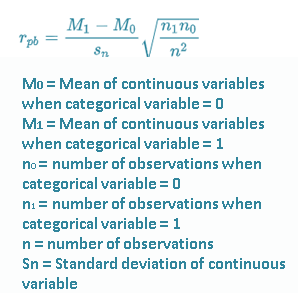
Examples of calculating point bi-serial correlation can be found here.
iii) Cramer’s V:
It is calculated as: √(X2/n) / min(c-1, r-1)
where:
- n: no. of observations
- c: no. of columns
- r: no. of rows
- X2: The Chi-square statistic
Examples of calculating Cramer’s V can be found here.
There are various other correlation metrics that can be considered based on their pros and cons (for more details refer here) but the metrics mentioned above are comparable and have the same range.
Here is a python function for implementing all the correlation metrics:
For calculating Pearson and bi-serial correlation, scipy package has functions corr and pointbiserialr. There is no direct function for calculating Cramer’s V in python though and hence I have added a function for that in the code snippet below. The function corr_feature_selectioncalculates the correlation based on the correlation type specified by the user and also selects the features based on thresholds provided by the user. For example, if the pearson_threshold is .5, it will select features above 50% absolute Pearson correlation.
#1.Select the top n features based on absolute correlation with train_target variable# Correlationpearson_list = []
point_bi_serial_list = ['LIMIT_BAL', 'AGE', 'BILL_AMT1',
'BILL_AMT2', 'BILL_AMT3', 'BILL_AMT4',
'BILL_AMT5', 'BILL_AMT6', 'PAY_AMT1',
'PAY_AMT2', 'PAY_AMT3','PAY_AMT4',
'PAY_AMT5', 'PAY_AMT6']cramer_list = ['SEX_woe', 'EDUCATION_woe',
'MARRIAGE_woe', 'PAY_0_woe',
'PAY_2_woe', 'PAY_3_woe', 'PAY_4_woe',
'PAY_5_woe', 'PAY_6_woe']pearson_threshold = .5
point_bi_serial_threshold = .5
cramer_threshold = .1################################ Functions ############################################################## Function to calculate Cramer's V
def cramers_V(var1,var2) :
crosstab=np.array(pd.crosstab(var1,var2,
rownames=None, colnames=None))
stat = chi2_contingency(crosstab)[0]
obs = np.sum(crosstab)
mini = min(crosstab.shape)-1
return (stat/(obs*mini))# Overall Correlation Function
def corr_feature_selection(data,target,pearson_list,
point_bi_serial_list,cramer_list,
pearson_threshold,
point_bi_serial_threshold,
cramer_threshold):
#Inputs
# data - Input feature data
# target - Target Variable
# pearson_list - list of continuous features (if target is continuous)
# point_bi_serial_list - list of continuous features (if target is categorical)/
# list of categorical features (if target is continuous)
# cramer_list - list of categorical features (if target is categorical)
# pearson_threshold - select features if pearson corrrelation is above this
# point_bi_serial_threshold - select features if biserial corrrelation is above this
# cramer_threshold - select features if cramer's v is above this
corr_data = pd.DataFrame()# Calculate point bi-serial
for i in point_bi_serial_list:
# Manual Change in Parameters - Point Bi-Serial
# Link to function parameters - https://docs.scipy.org/doc/scipy-0.14.0/reference/generated/scipy.stats.pointbiserialr.html
pbc = pointbiserialr(target, data[i])
corr_temp_data = [[i,pbc.correlation,"point_bi_serial"]]
corr_temp_df = pd.DataFrame(corr_temp_data,
columns = ['Feature',
'Correlation',
'Correlation_Type'])
corr_data = corr_data.append(corr_temp_df)# Calculate cramer's v
for i in cramer_list:
cramer = cramers_V(target, data[i])
corr_temp_data = [[i,cramer,"cramer_v"]]
corr_temp_df = pd.DataFrame(corr_temp_data,
columns = ['Feature',
'Correlation',
'Correlation_Type'])
corr_data = corr_data.append(corr_temp_df)# Calculate pearson correlation
for i in pearson_list:
# Manual Change in Parameters - Perason
# Link to function parameters - https://pandas.pydata.org/docs/reference/api/pandas.DataFrame.corr.html
pearson = target.corr(data[i])
corr_temp_data = [[i,pearson,"pearson"]]
corr_temp_df = pd.DataFrame(corr_temp_data,
columns = ['Feature',
'Correlation',
'Correlation_Type'])
corr_data = corr_data.append(corr_temp_df)# Filter NA and sort based on absolute correlation
corr_data = corr_data.iloc[corr_data.Correlation.abs().argsort()]
corr_data = corr_data[corr_data['Correlation'].notna()]
corr_data = corr_data.loc[corr_data['Correlation'] != 1]
# Add thresholds
# initialize list of lists
data = [['pearson', pearson_threshold],
['point_bi_serial', point_bi_serial_threshold],
['cramer_v', cramer_threshold]] threshold_df = pd.DataFrame(data,
columns=['Correlation_Type',
'Threshold'])
corr_data = pd.merge(corr_data,threshold_df,
on=['Correlation_Type'],how = 'left')# Select Features with greater than user dfined absolute correlation
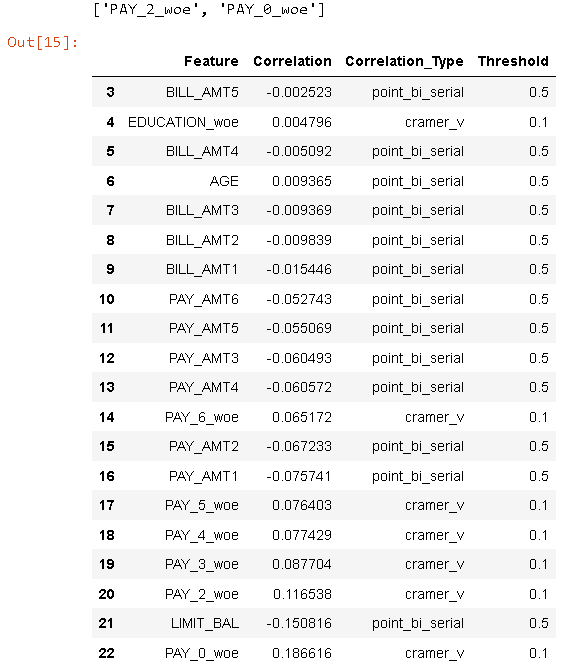
corr_data2 = corr_data.loc[corr_data['Correlation'].abs() > corr_data['Threshold']]
corr_top_features = corr_data2['Feature'].tolist()
print(corr_top_features)
corr_top_features_df = pd.DataFrame(corr_top_features,columns = ['Feature'])
corr_top_features_df['Method'] = 'Correlation'
return corr_data,corr_top_features_df################################ Calculate Correlation #############################################################corr_data,corr_top_features_df = corr_feature_selection(train_features_v2,train_target,
pearson_list,point_bi_serial_list,
cramer_list,pearson_threshold,
point_bi_serial_threshold,cramer_threshold)
corr_data.tail(30)
C) Weight of Evidence (WOE) and Information Value (IV)
These two terms have been used extensively for feature selection across multiple fields (especially for credit score models). WOE indicates the degree of the predictive power of a feature. It assumes that the target variable in the model is dichotomous (i.e has two values like events and non-events). It is calculated using the following steps:
- For continuous feature, split data into bins
- For each bin, calculate the % of observations under events and % of observations under non-events.
- Calculate WOE using the following formula for each bin

As shown above, WOE calculates the predictive power for each bin in a feature. We can then use IV to aggregate the WOE to get the predictive power for the feature as a whole. It is calculated as:

where h is the number of bins.
Here is a python function for calculating WOE and IV:
Similar to the function corr_feature_selection, iv_woe calculates the WOE and IV and selects the features based on thresholds provided by the user. For example, if the iv_threshold is .1, it will select features with IV greater than .1. The user can also select how many bins are needed for continuous variables.
#2. Select top features based on information value# Information valueshow_woe = True
iv_bins = 10
iv_threshold = .1################################ Functions #############################################################def iv_woe(data, target, iv_bins,iv_threshold, show_woe):
#Inputs
# data - Input Data including target variable
# target - Target Variable name
# iv_bins - Number of iv_bins
# show_woe - show all the iv_bins and features
# iv_threshold - select features with IV greater than this
#Empty Dataframe
newDF,woeDF = pd.DataFrame(), pd.DataFrame()
#Extract Column Names
cols = data.columns
#Run WOE and IV on all the independent variables
for ivars in cols[~cols.isin([target])]:
if (data[ivars].dtype.kind in 'bifc') and (len(np.unique(data[ivars]))>10):
binned_x = pd.qcut(data[ivars], iv_bins, duplicates='drop')
d0 = pd.DataFrame({'x': binned_x, 'y': data[target]})
else:
d0 = pd.DataFrame({'x': data[ivars], 'y': data[target]})# Calculate the number of events in each group (bin)
d = d0.groupby("x", as_index=False).agg({"y": ["count", "sum"]})
d.columns = ['Cutoff', 'N', 'Events']
# Calculate % of events in each group.
d['% of Events'] = np.maximum(d['Events'], 0.5) / d['Events'].sum()# Calculate the non events in each group.
d['Non-Events'] = d['N'] - d['Events']
# Calculate % of non events in each group.
d['% of Non-Events'] = np.maximum(d['Non-Events'], 0.5) / d['Non-Events'].sum()# Calculate WOE by taking natural log of division of %
# of non-events and % of events
d['WoE'] = np.log(d['% of Events']/d['% of Non-Events'])
d['IV'] = d['WoE'] * (d['% of Events'] - d['% of Non-Events'])
d.insert(loc=0, column='Variable', value=ivars)
print("Information value of " + ivars + " is " +
str(round(d['IV'].sum(),6)))
temp =pd.DataFrame({"Variable" : [ivars],
"IV" : [d['IV'].sum()]},
columns = ["Variable", "IV"])
newDF=pd.concat([newDF,temp], axis=0)
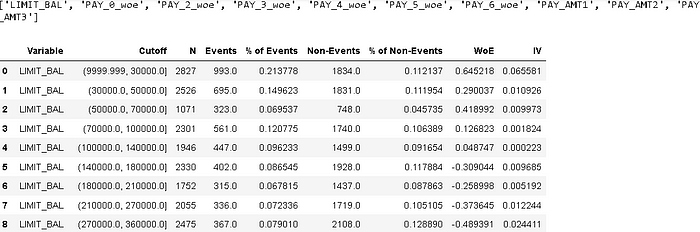
woeDF=pd.concat([woeDF,d], axis=0)#Show WOE Table
if show_woe == True:
print(d)
# Aggregate IV at feature level
woeDF_v2 = pd.DataFrame(woeDF.groupby('Variable')['IV'].agg('sum'),
columns= ['IV']).reset_index()
woeDF_v3 = woeDF_v2.sort_values(['IV'], ascending = False)
IV_df = woeDF_v2[woeDF_v2['IV']> iv_threshold]
woe_top_features = IV_df['Variable'].tolist()
print(woe_top_features)
woe_top_features_df = pd.DataFrame(woe_top_features,columns = ['Feature'])
woe_top_features_df['Method'] = 'Information_value'
return newDF, woeDF,IV_df, woe_top_features_df################################ Calculate IV #############################################################train_features_v3_temp = pd.concat([train_target, train_features_v2],
axis =1)newDF, woeDF,IV_df, woe_top_features_df = iv_woe(train_features_v3_temp,
target,iv_bins,iv_threshold,
show_woe)
woeDF.head(n=50)
Here is a popular classification of features based on IV:
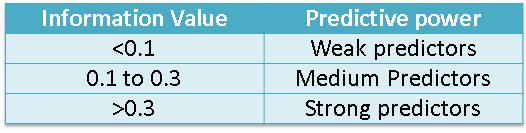
Given WoE and IV are good at explaining linear relationships, it is important to remember that the features selected using IV might not be the best feature set for a non-linear model. Additionally, this feature selection method should be used only for classification problems.
Final Words
I hope this blog series helps fellow data scientists identify the real gems (read best features) in their datasets using the best that ML methods have to offer. The entire end-to-end analysis can be found here. In the first section we discussed the following:
- Overview of various types of feature selection methods
- Types of correlation metrics to use for feature selection — theory and python implementation
- What are WOE and IV and how to calculate them? And their python implementation
Although the filter methods we discussed in this blog are easy to compute and understand, they are not the best option for multi-variate modeling (models with multiple features). That is why I would urge the readers to check out the next blog which focuses on some interesting wrapper and embedded methods like Lasso regression, Beta coefficients, Recursive feature selection etc..
Do you have any questions or suggestions about this blog? Please feel free to drop in a note.
Reference Material
- An overview of correlation measures between categorical and continuous variables
- How to Calculate Cramer’s V in Excel
- Point-Biserial Correlation using SPSS Statistics
Let’s Connect!
If you, like me, are passionate about AI, Data Science or Economics, please feel free to add/follow me on LinkedIn, Github and Medium.
